Part 1 ended with a car that drove forward when I clenched my jaw. It worked, but the signal driving it was electromyography (EMG) from the jaw muscle, not anything from the brain. The next step was to find out whether the same headset could read the brain signal that I was looking for.
The hypothesis
Motor imagery is the established paradigm for this. When you imagine moving a limb without moving it, the motor cortex produces event-related desynchronization (ERD) - a drop in power in the mu (8-13 Hz) and beta (13-30 Hz) bands over the sensorimotor cortex. Detect the drop, and you have a signal that tracks intent.
Event-related desynchronization (ERD)
The expected drop in power is because activity going up shows as power going down. At rest, a patch of sensorimotor cortex fires in synchrony, and synchronized firing across a large population of neurons sums into a strong rhythm in the mu band. When the area engages - real movement, or imagined movement - that synchrony breaks up. The neurons stop firing together, the summed rhythm weakens, and the power in the band falls. So, activation shows up as less power, not more, and the name is literal: event-related desynchronization.
Fp1 sits over the forehead, not over the motor cortex. The mu rhythm comes from sensorimotor cortex, which is why motor imagery is normally read from C3 and C4 over those areas. Most of the literature treats frontal sites as the wrong place to look for it - a forehead electrode is far from the source, and the standard montages put nothing useful there for motor imagery. I went ahead anyway. The signal might still reach a frontal electrode through some volume conduction and network connectivity. That gives a testable prediction: if motor imagery is detectable at Fp1 at all, mu/beta band power should be lower during imagery compared to rest.
Required methodology
ERD is a drop in power, not a drop in voltage. The raw data plotted on a graph stays about the same size and shape during the motor imagery task. What changes is how much of the signal sits inside one frequency band. Since a raw-voltage comparison cannot see that, the analysis has to work on the power spectrum instead.
Testing method
Testing this needed labelled data - clean rest periods and clean imagery periods, kept separate. I wrote a small console program to run the trials. Each trial had three phases:
- REST - sit still, baseline
- CUE - a prompt to get ready
- FISTS - imagine clenching both hands, without moving them
The program streamed the raw signal and tagged every sample with the current phase, so each sample was labelled
restorimageryfor later analysis.
I set the phase durations from a brief literature review of motor imagery protocols: REST 3 seconds, FISTS 5 seconds, and a short CUE phase in between. Then, I recorded data for three subjects - two of whom did 20 trials and one did 40.
Frequency domain analysis
To get band power I used Welch’s method to estimate the power spectral density, then integrated within the mu and beta bands.
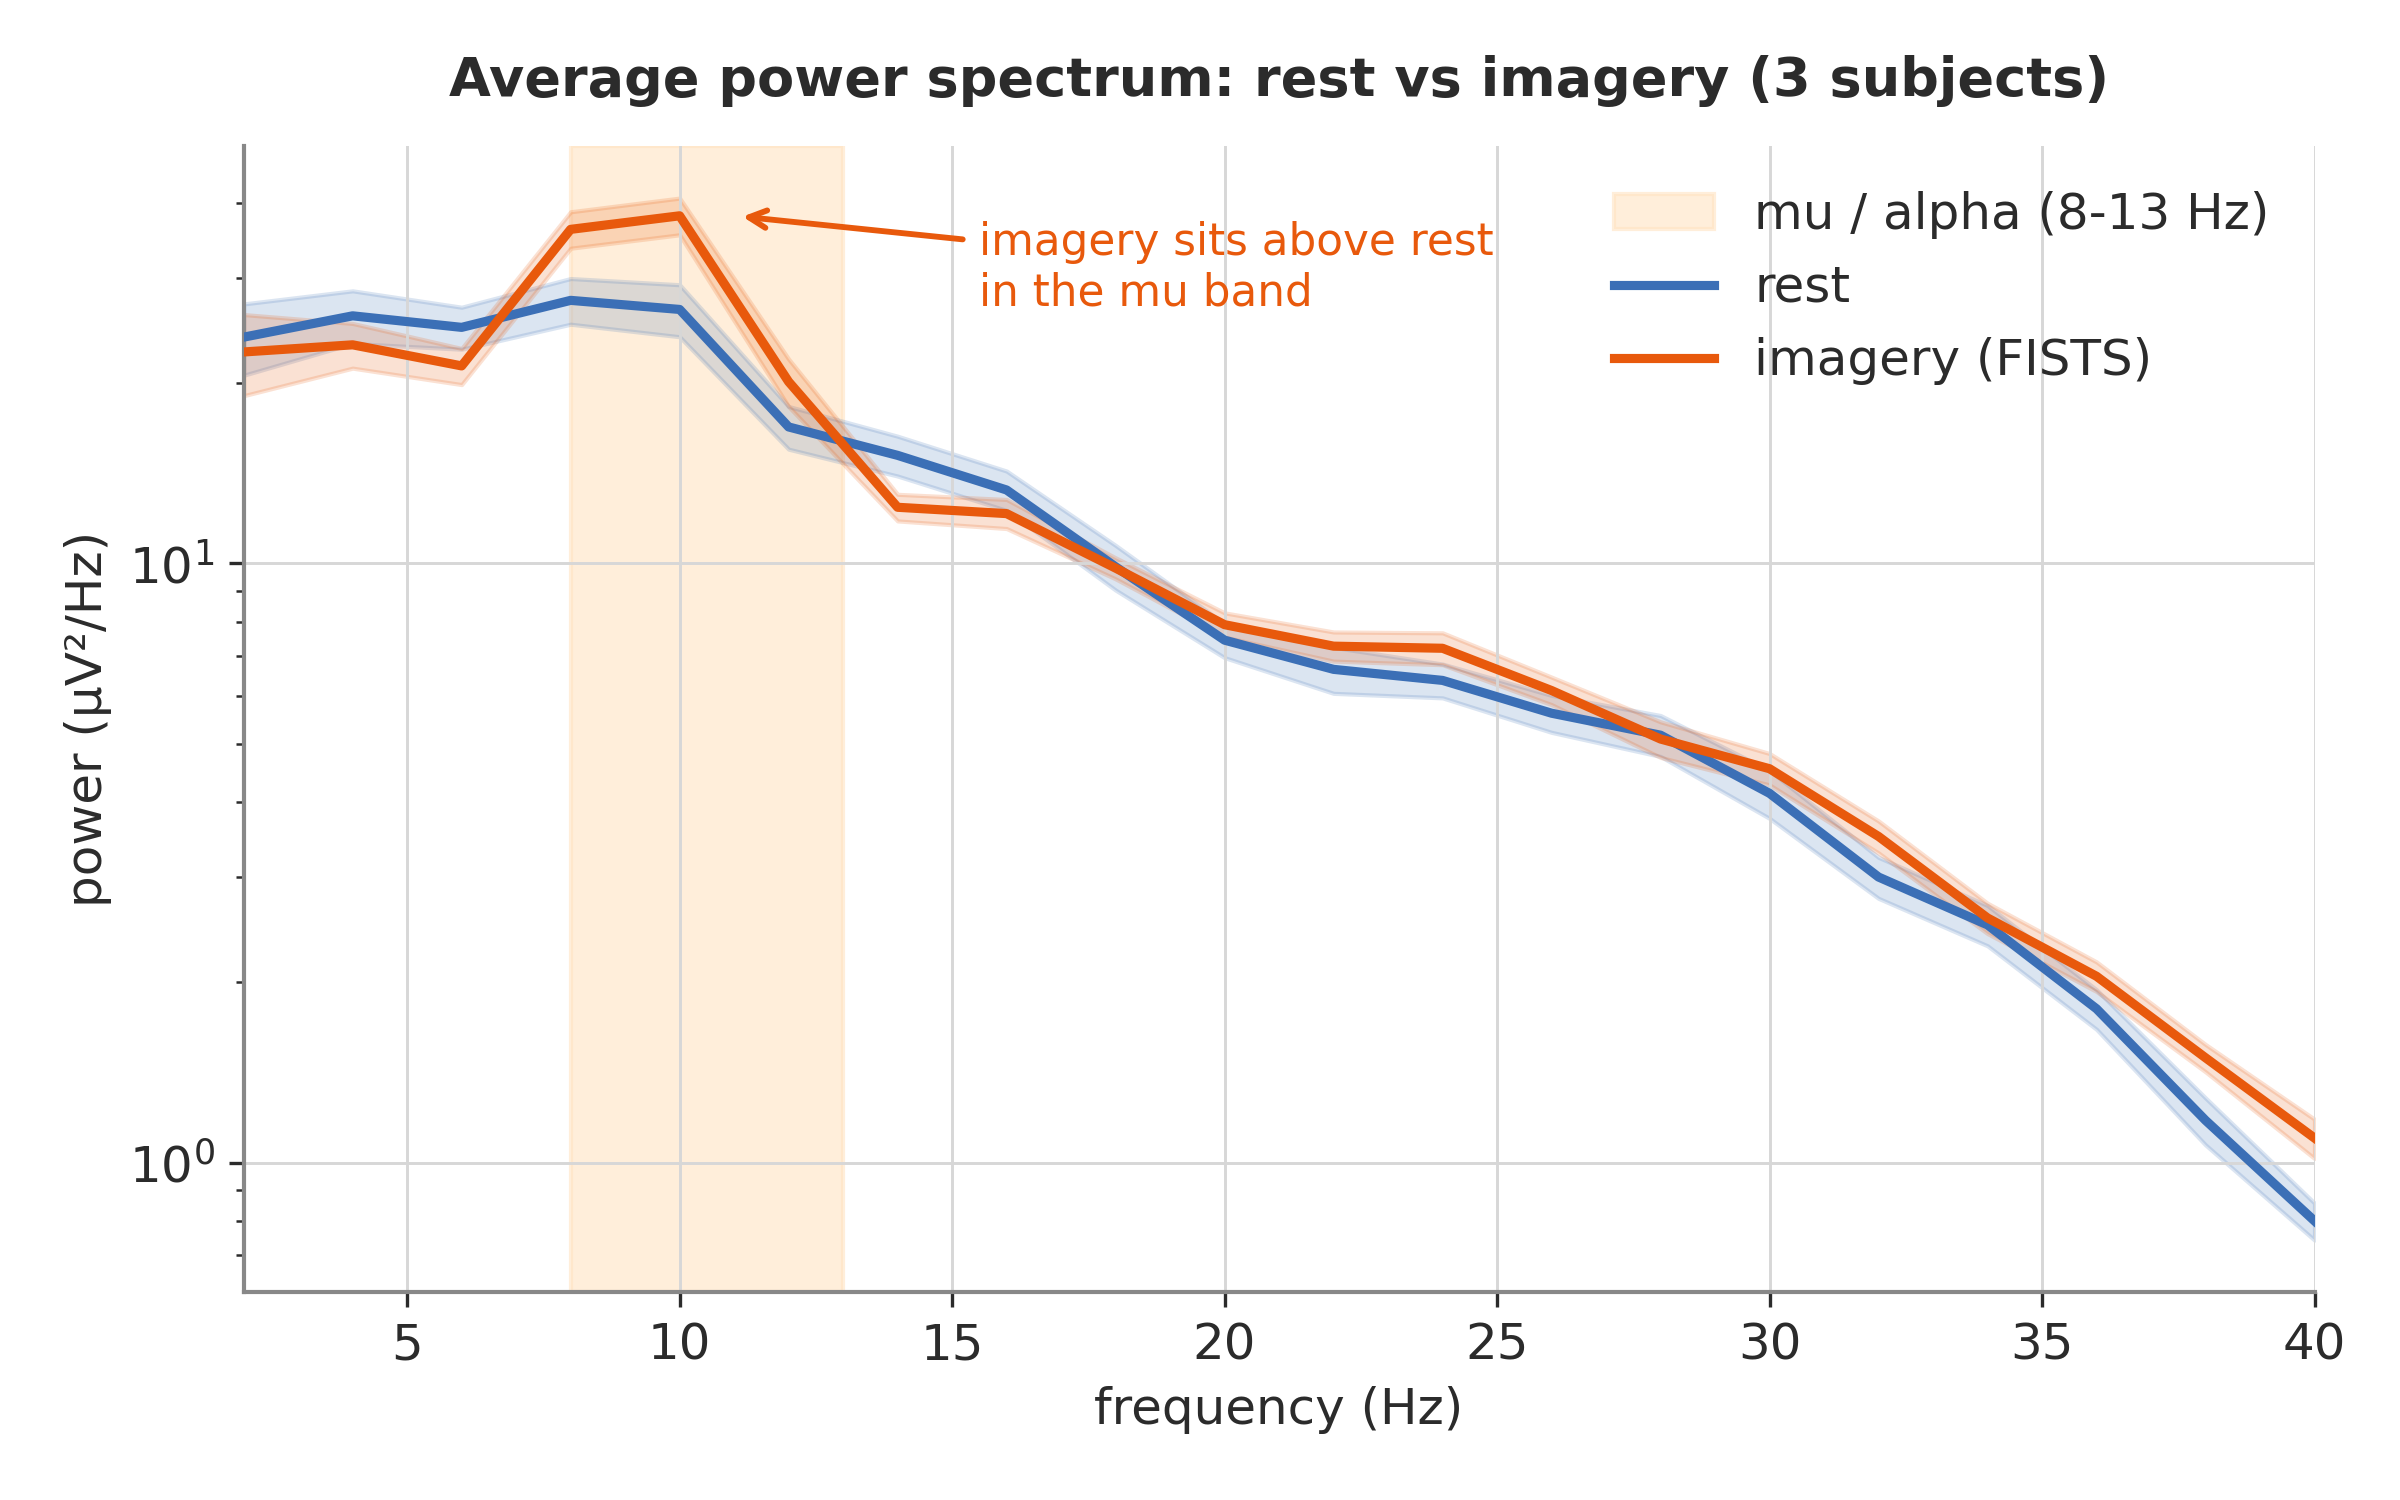
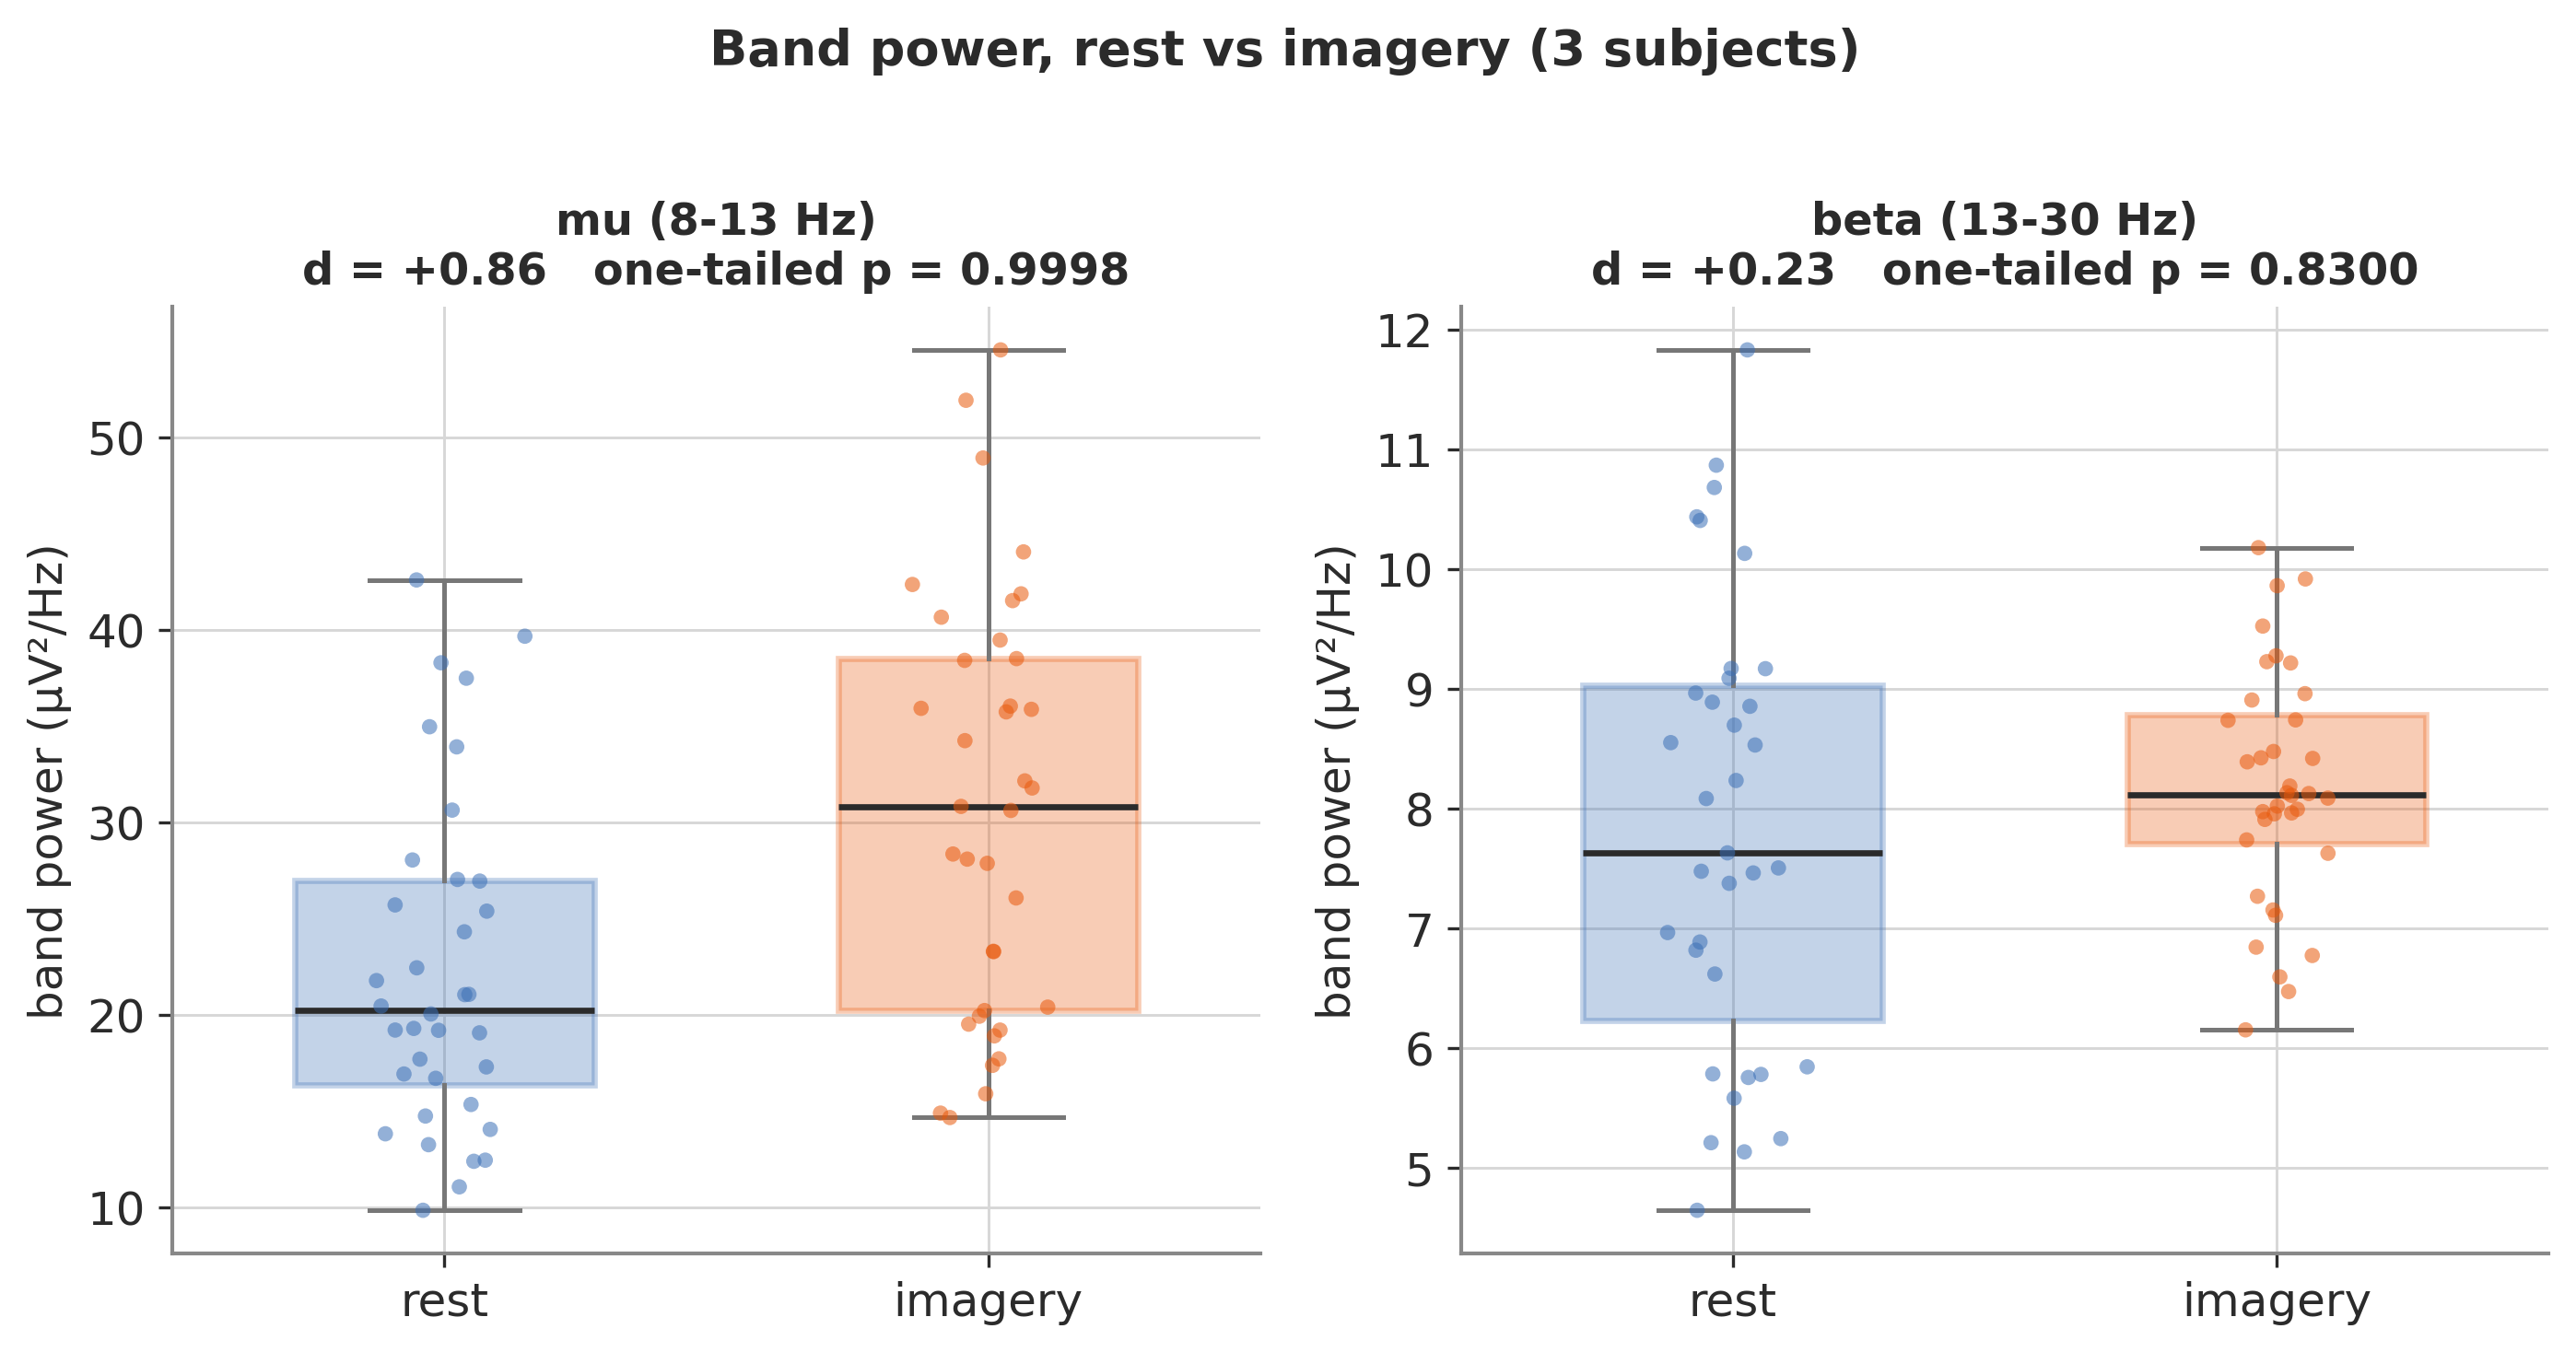
Since I had a directional hypothesis, I used a one-tailed t-test, which showed that the mu band power actually increased during imagery. Power in 8-13 Hz was higher during imagery than during rest - with a large effect (Cohen’s d = +0.86) pointing the opposite way from the prediction, and a p value of 0.9998.
Note
By mistake, I used an independent-samples t-test. The data from rest and imagery came from the same trial, so a paired t-test would have been a proper choice. However, even fixing the mistake would not have changed the conclusion.
Beta did the opposite. On the first two runs, 13-30 Hz power dropped during imagery (d = -0.53, p around 0.06), which is the correct direction that the motor ERD predicts. However, adding more data reversed it to a slight increase (d = +0.23, p = 0.83). This result suggested that the beta effect was a small-sample accident, not a signal. The mu increase is the only thing that survived more data.
Frontal alpha vs motor mu
An increase in 8-13 Hz power during a mental task has a more probable explanation than motor-cortex connectivity. The mu rhythm and the alpha rhythm sit in the same frequency band (8-13 Hz) but come from different places and respond to different things. Mu is over sensorimotor cortex and desynchronizes with movement and motor imagery. Alpha band power, on the other hand, increases with mental effort and concentration exactly in frontal regions, which is why my Fp1 electrode picked it up. Since performing motor imagery took concentration, the 8-13 Hz signal I extracted was actually the concentration signal carried by the alpha rhythm.
Limitations
Unfortunately, the hypothesis did not hold. My small study produced a strong and replicable (within my own hardware) result, but failed to observe the signal I was actually looking for. A single frontal electrode could not read motor imagery. For real motor imagery you need electrodes over that cortex - C3 and C4 at minimum.
Placement was not the only limitation. The MindWave is a hobby-grade headset - one dry electrode at Fp1, not the wet electrodes of a research-grade setup. Dry contact sits at higher impedance and picks up more noise, so even if a faint motor component reached the forehead, this was the wrong tool to catch it.
That result left two forward directions. One was to take the frontal alpha signal for what it was and build control around concentration instead of motor imagery. The other was to change the hardware and put electrodes where the motor signal actually is. Which one I picked is the next part.