In the previous part
In Part 5 I assembled the ADS1299 recorder and recovered 6 eye-blink artifacts from an electrode at Fp1. This showed that the batteries, electrodes, recorder, Pico, wireless link, and acquisition software could collect a biological signal from my head. The peaks were produced by my eyes, however, not by electrical activity in the brain. I still had to verify that the set could record actual EEG.
Why blinks were not enough
Eye blinks were useful for bringing up the recorder because they produced large and easily recognizable deflections near Fp1. That also made them a fairly undemanding test. A recording path could preserve the blink artifacts while adding enough noise or drift to hide the smaller rhythms I eventually needed for motor imagery.
Moving directly to the C3/C4/Cz montage would not resolve this cleanly. If I found no difference between left- and right-hand imagery, the recorder could be too noisy, the electrode contacts could be poor, the analysis could be wrong, or I might simply not produce a strong motor imagery response. I first needed a simpler EEG effect with a clear prediction.
Why I tested alpha
I selected the alpha rhythm, an oscillation around 8-12 Hz that is commonly visible over the posterior part of the head. In a relaxed awake person, posterior alpha usually becomes stronger after closing the eyes and weaker again after opening them. This gave me 2 things to check at once: the frequency of the signal and whether it followed an instructed change in my state.
If the recorder was capturing posterior alpha, closing my eyes should produce a relatively narrow peak around 10 Hz rather than only a general increase in low-frequency activity. That peak should appear during every eyes-closed period and disappear again when I opened my eyes. A blink could produce one large deflection. It could not conveniently reproduce that pattern 3 times in a row.
The experiment
I placed the recording electrode at O1, the reference electrode on my earlobe, and the bias electrode at Fpz. Channel 1 of the ADS1299 was sampled at 250 Hz with a gain of 12. The complete subject-connected circuit remained battery-powered and transmitted the raw samples over Wi-Fi.
The recording lasted 130 seconds. After a 10-second settling period, I completed 3 cycles consisting of 20 seconds with my eyes open followed by 20 seconds with my eyes closed. Spoken cues marked each transition, and the (custom) acquisition software stored the condition boundaries together with the sample sequence so I could compare the signal against the instructed state.
Calculating alpha power
I divided the raw recording into 2-second windows with 1-second overlap. Each window was linearly detrended and multiplied by a Hann window before calculating its power spectrum at 0.5 Hz resolution. Alpha power was the integrated power from 8 through 12 Hz. Windows crossing a missing-sample gap were excluded rather than treated as continuous data.
The signal followed the eye-state changes
Alpha power increased after each eyes-closed cue and decreased after each eyes-open cue. The absolute values varied inside the 20-second blocks, but the separation between the conditions remained visible through all 3 cycles.
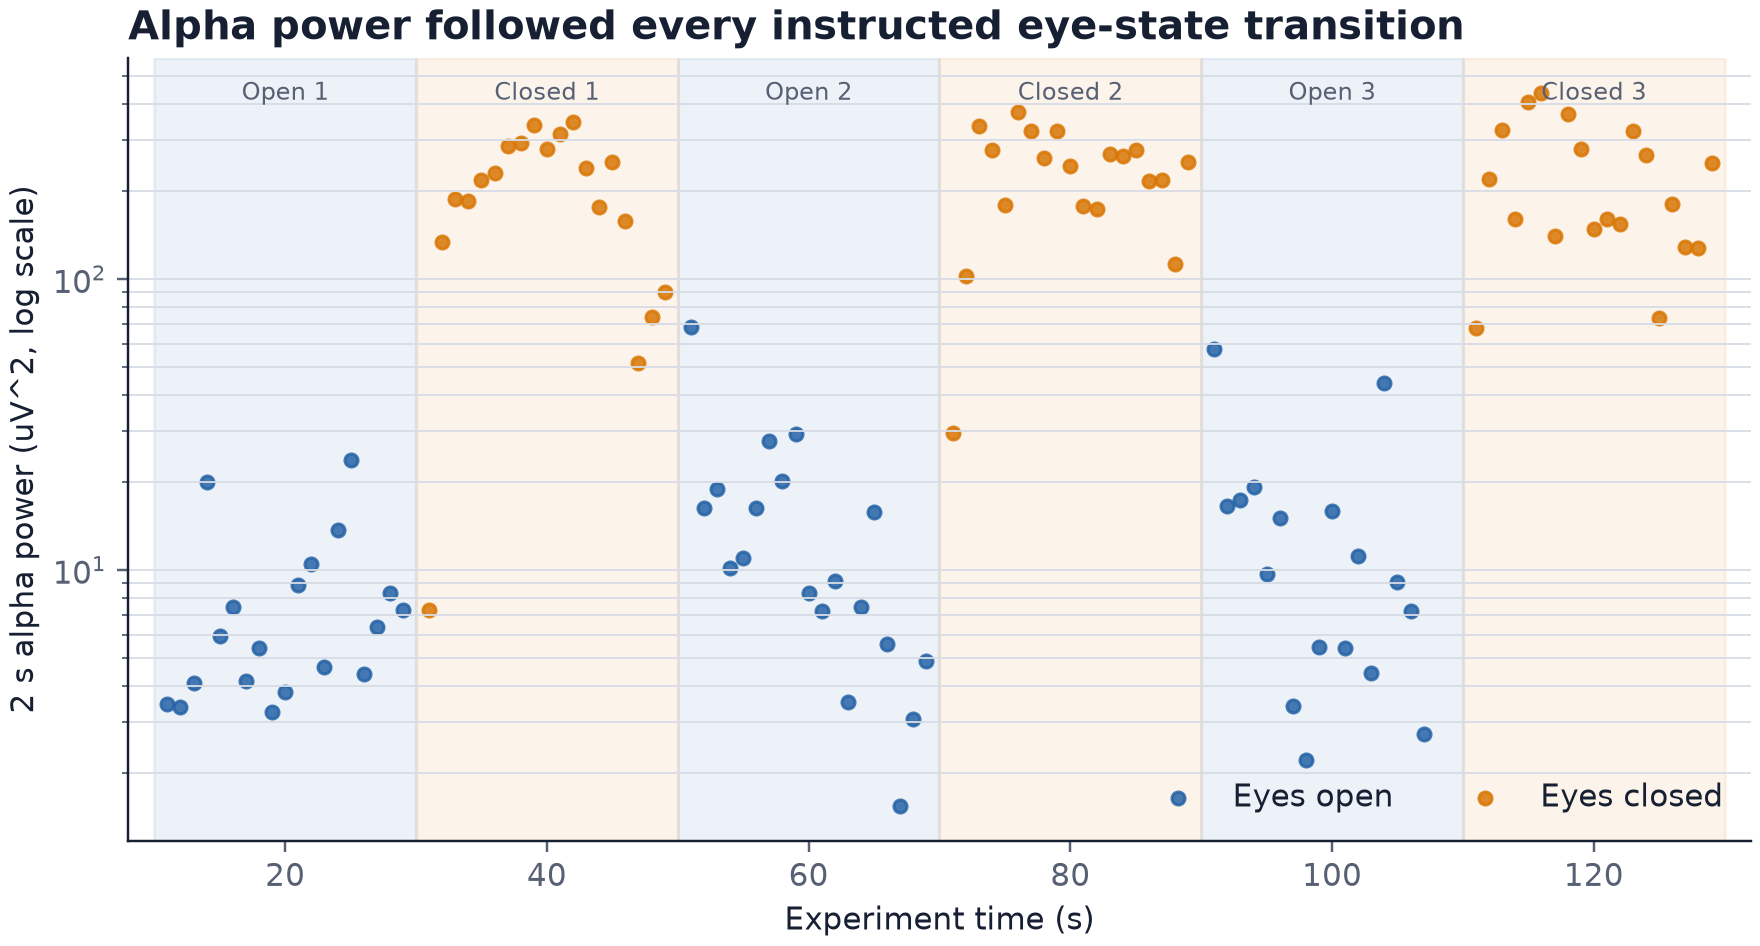
Mean alpha power was 12.44 µV² with my eyes open and 219.13 µV² with my eyes closed, which was a 17.61-fold increase. More importantly for this test, all 3 cycles changed in the same direction. The result was not produced by one convenient part of the recording.
The change was concentrated near 10 Hz
The timing alone showed that the signal followed the instructions, but it did not yet identify what produced it. Eye movements, electrode motion, and slow changes in contact can also differ between periods with eyes open and closed. Their spectral energy is usually broader and concentrated at lower frequencies, so I also compared the average power spectra of the 2 conditions.
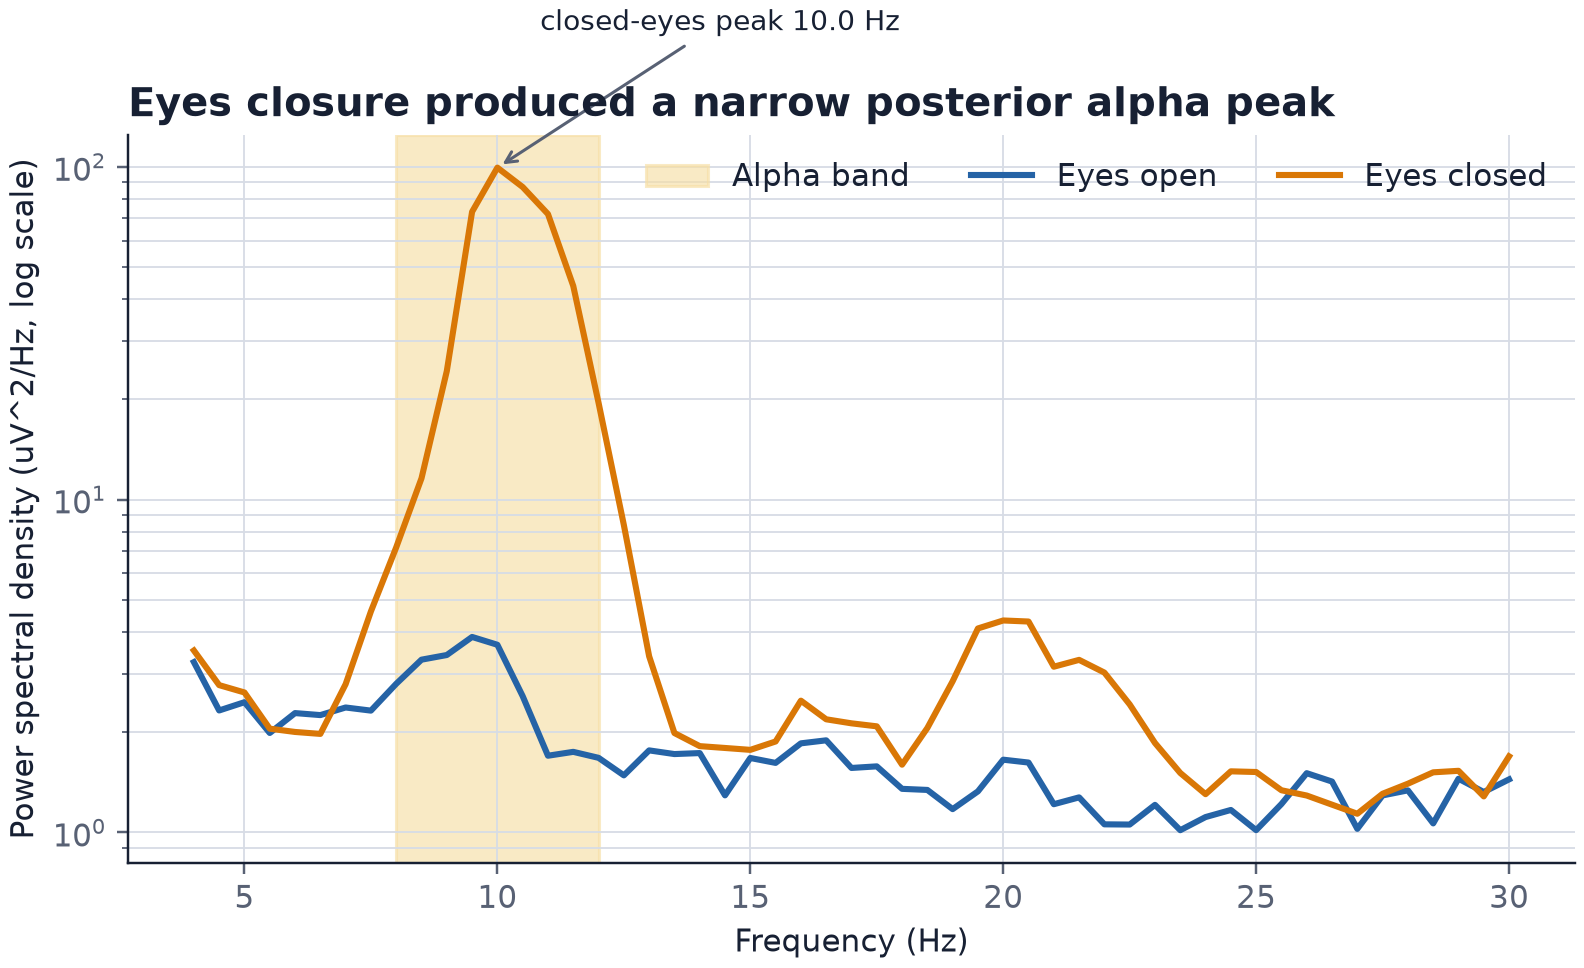
With my eyes closed, the spectrum formed a narrow peak at approximately 10 Hz inside the expected alpha band. The peak was at 10.0 Hz in the first 2 closed-eye blocks and 10.5 Hz in the third. The eyes-open spectrum stayed much lower in the same range.
The frequency and timing therefore agreed with each other: the recorder measured an oscillation in the expected alpha range, the oscillation increased after every eyes-closed instruction, and it decreased again after every eyes-open instruction. A stable source of electrical interference would not be expected to follow 6 alternating instructions in this way, while a broad movement artifact would not explain the narrow 10 Hz peak.
What this test established
The recording contained 99.94% of the expected samples. In total, 20 samples were missing from 32,500, and neither of the 2 short gaps occurred during an eyes-closed block. Re-analyzing the stored raw samples also reproduced the aggregate alpha-power result saved during acquisition. The observed change was therefore present in the recording itself rather than introduced later by selecting particular sections of it.
Taken together, these observations were strong evidence that the complete path from the electrodes, through the ADS1299 and Pico, to the saved data could preserve a condition-dependent EEG rhythm. The blink test had shown that the recorder captured something from my head. This test showed that it captured brain activity with enough frequency and temporal detail to identify posterior alpha.
Scope of the result
This was 1 person, 1 electrode placement, and 1 session with only 3 open/closed cycles in a fixed order. It was an engineering validation of my acquisition setup, not an estimate of alpha modulation in other people or a test of reliability across days. It also did not show that motor imagery would produce a signal that I could classify.
The acquisition chain was now good enough to stop testing it with deliberately easy signals. The next step is now to move the electrodes to C3, C4, and Cz and check for the subtler mu changes produced by motor imagery.